
Source: Bureau of Economic Analysis (BEA)
Gross National Income is similar to GDP and GNP
BEA defines GNI as “The sum of incomes earned and costs incurred in production by labor and property supplied by U.S. residents. It is equal to gross domestic income plus income receipts from the rest of the world less income payments to the rest of the world. It is also equal to gross national product less the statistical discrepancy.”
Like GNP, Gross National Income is harder to extract through the NIPA tables, Section 1, of the BEA website than is GDP.
FRED does it for you:
The Federal Reserve Economic Data is a great resource to view graphs of Gross National Income both Real and Nominal.
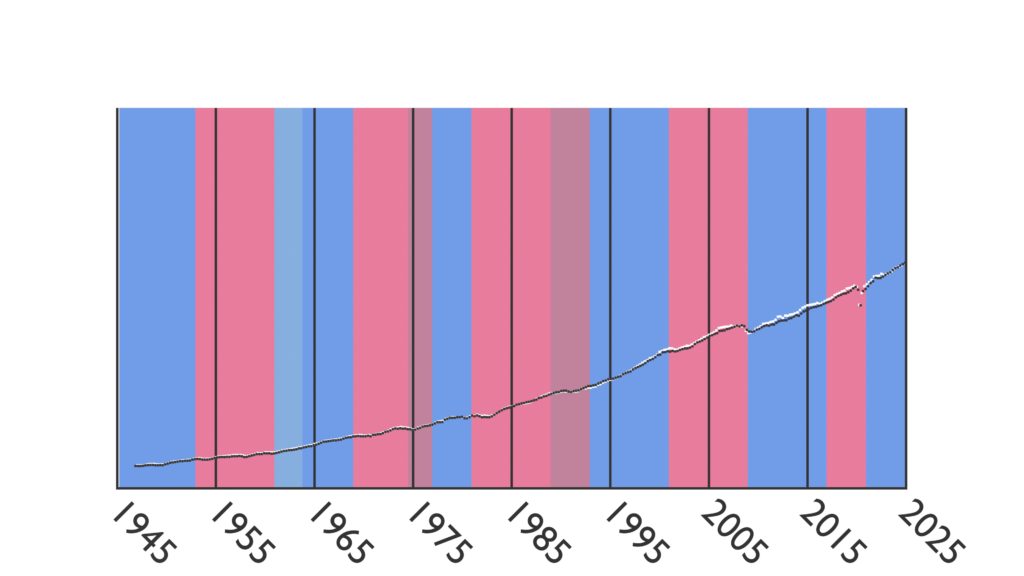
This is Real GNI graphed quarterly from 1947 to present (2nd quarter 2024).
GNP in white.
GDP in black.
GNI in Billions of 2017 dollars by President:
| PRESIDENT | START | END | % CHANGE | AVERAGE CHANGE/YEAR |
|---|---|---|---|---|
| Truman | 2,169.189 | 2,846.469 | 31.22% | 5.2% |
| Eisenhower | 2,846.469 | 3,523.574 | 23.79% | 2.97% |
| Kennedy | 3,523.574 | 4,089.247 | 16.05% | 5.35% |
| Johnson | 4,089.247 | 5,251.899 | 28.43% | 5.69% |
| Nixon | 5,251.899 | 6,110.309 | 16.34% | 2.84% |
| Ford | 6,110.309 | 6,435.064 | 5.31% | 2.36% |
| Carter | 6,435.064 | 7,345.343 | 14.15% | 3.54% |
| Reagan | 7,345.343 | 9,731.372 | 32.48% | 4.06% |
| H.W. Bush | 9,731.372 | 10,376.905 | 6.63% | 1.66% |
| Clinton | 10,376.905 | 14,389.45 | 38.67% | 4.83% |
| W. Bush | 14,389.45 | 16,366.615 | 13.74% | 1.72% |
| Obama | 16,366.615 | 19,472.634 | 18.98% | 2.37% |
| Trump (1st term) | 19,472.634 | 21,060.742 | 8.16% | 2.04% |
| Biden | 21,060.742 | 23,217.692 | 10.24% | 2.56% |
From 1947 to Q3 of 2024, there were 14 Presidential administrations with Democrats in office for 37.75 years and Republicans for 40 years.
Like GDP, the 77.75-year GNI span shows Democrat Presidents presided over majority of growth, 59.82% to Republican’s 40.18%, despite Republicans having more time by 2-and-a-quarter years.
Finally, Trump is not the worst in the past 80 years. He is 3rd last behind H.W. and W. Bush.
For those that have not seen the other tables, that is 3-0 Democrats:
GDP growth was Democrats 58.33% to Republicans 41.67%
GNP growth was Democrats 58.57% to Republicans 41.43%
Now, we see GNI growth is Democrats 59.82% to Republicans 40.18%