Source: Bureau of Economic Analysis (BEA)
GDP is published quarterly [calendar year] by the BEA, with three estimates for each of those quarters. The advance estimate is released roughly one month after the quarter ends; the preliminary estimate is released one month after that; and the final estimate one month after the preliminary estimate.
The Federal Reserve Economic Data, FRED, is a great resource to view graphs of Gross Domestic Product.
Gross Domestic Product is one of the most important measures of the economy.
As Defined on the BEA website, Gross Domestic Product is “A comprehensive measure of U.S. economic activity. GDP measures the value of the final goods and services produced in the United States (without double counting the intermediate goods and services used up to produce them). Changes in GDP are the most popular indicator of the nation’s overall economic health.”

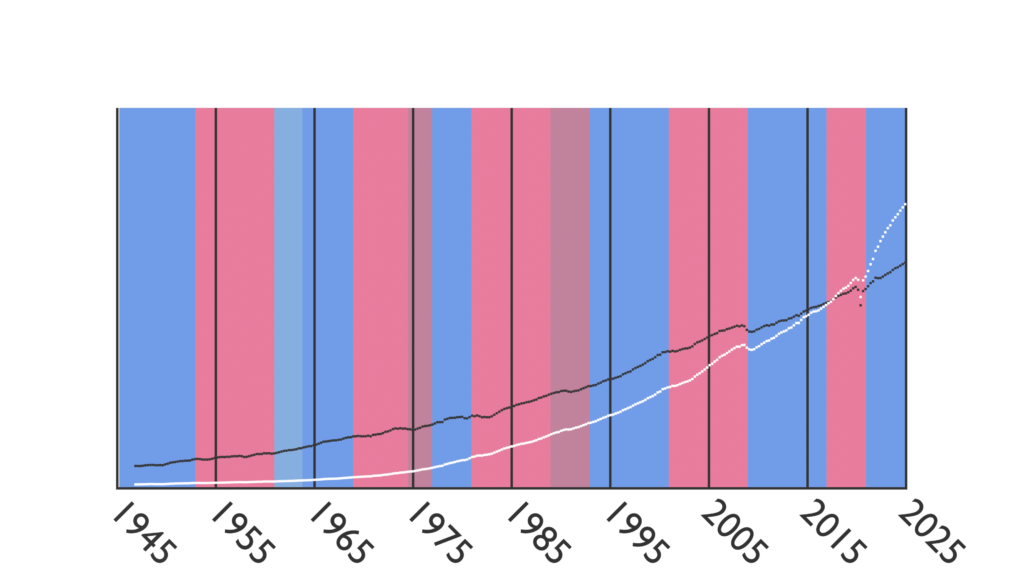
This is GDP graphed quarterly from 1947 to the latest release, December 19, 2024. The next release, quarter 4 of 2024, will be January 30, 2025.
Nominal in white.
Inflation adjusted to 2017 dollars in black.
Red/Blue background corresponds to Presidential administrations of the time.
GDP in Billions of 2017 dollars by President:
| PRESIDENT | START | END | % CHANGE | AVERAGE CHANGE/YEAR |
|---|---|---|---|---|
| Truman | 2,182.681 | 2,843.941 | 30.3% | 5.05% |
| Eisenhower | 2,843.941 | 3,470.278 | 22.02% | 2.75% |
| Kennedy | 3,470.278 | 4,050.147 | 16.71% | 5.57% |
| Johnson | 4,050.147 | 5,202.212 | 28.45% | 5.69% |
| Nixon | 5,202.212 | 6,053.978 | 16.37% | 2.85% |
| Ford | 6,053.978 | 6,451.177 | 6.56% | 2.92% |
| Carter | 6,451.177 | 7,315.677 | 13.4% | 3.35% |
| Reagan | 7,315.677 | 9,673.405 | 32.23% | 4.03% |
| H.W. Bush | 9,673.405 | 10,558.648 | 9.15% | 2.29% |
| Clinton | 10,558.648 | 14,229.765 | 34.77% | 4.35% |
| W. Bush | 14,229.765 | 16,485.35 | 15.85% | 1.98% |
| Obama | 16,485.35 | 19,304.352 | 17.1% | 2.14% |
| Trump (1st term) | 19,304.352 | 20,771.691 | 7.6% | 1.9% |
| Biden | 20,771.691 | 23,400.294 | 12.65% | 3.37% |
From 1947 to Q3 of 2024, there were 14 Presidential administrations with Democrats in office for 37.75 years and Republicans for 40 years.
Despite the Republicans holding office longer, GDP increased 12,376.416 Billion under Democrats and 8,841.197 Billion under Republicans.
That is 58.33% of total GDP growth during Democrat administrations to 41.67% during Republican administrations.
The only problem with Trump’s statement “It seems that the economy does better under the Democrats than the Republicans.” is using the word “seems”. Not only did GDP perform much worse for Republican administrations, Trump’s record was the worst of them.
Get your OutVote Stupid gear here!
Nominal vs Real
Nominal means recording each measurement in the dollar value at the time of each measurement.
Real means inflation adjusted – each measurement is in a common dollar value, referred to as a base year.
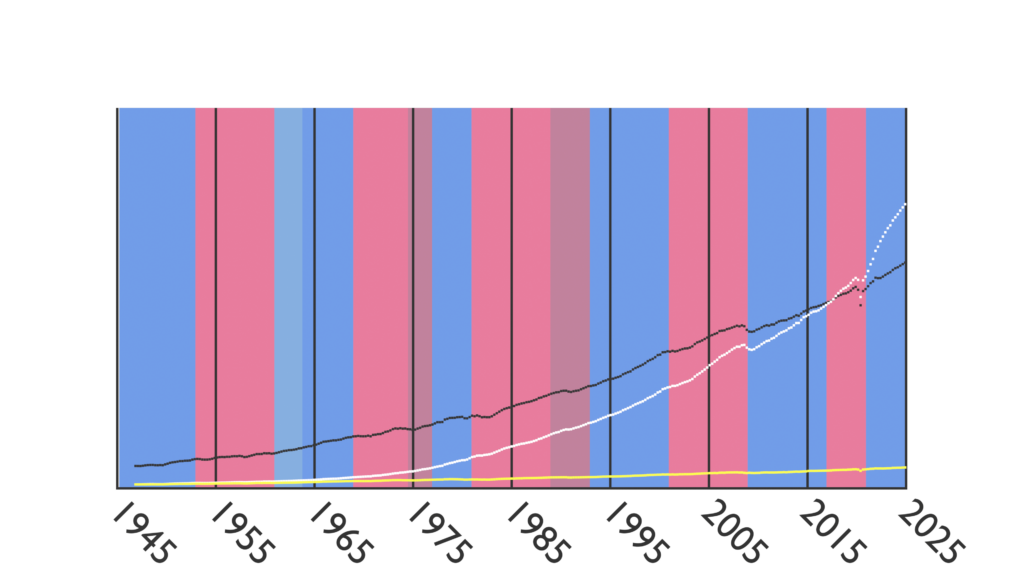
In this illustration, we added the Real GDP with 1947 base (yellow).
Due to inflation, the dollar generally loses value on a steady basis. That is why it takes much fewer 1947 dollars to represent the same value of 2025 GDP.
Nominal and 1947 base intersect in 1947 because dollars are equal just as nominal and Real 2017 intersect in 2017.
Before 2017, nominal dollars are worth more, therefore it takes less to represent the same value GDP. After 2017, nominal dollars are worth less so it takes more to represent the same value GDP.


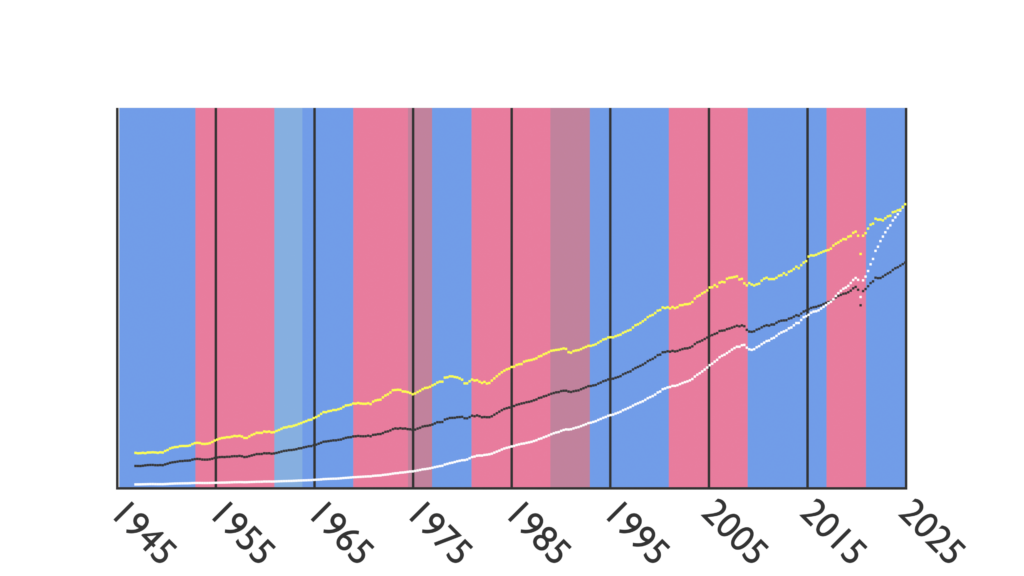
Here we see the 2024 base.
As you should have guessed, nominal and 2024 base GDP intersect in 2024.
Also note that Real 2017 base and 2024-base never intersect. 2017 dollars are always worth more than 2024 dollars.
Therefore the 2017 base line will always be below the 2024 line. It is the exact same value of GDP in each line; but, it takes fewer 2017 dollars to represent that value.
