Source: U.S. Department of the Treasury
The Treasury Department offers the Daily Treasury Statement (DTS), U.S. Treasury Monthly Statement of the Public Debt (MSPD), Debt to the Penny, and Historical Debt Outstanding to view details of the national debt online. They also offer a quick guide to understanding the debt and many articles, tools, and resources to delve as deep into the subject as you wish.
FRED offers graphed and downloadable datasets on national debt such as Total Public Debt, Federal Debt Held by Federal Reserve Banks, Federal Debt Held by Foreign and International Investors, and Total Public Debt as Percent of Gross Domestic Product to name just a few.

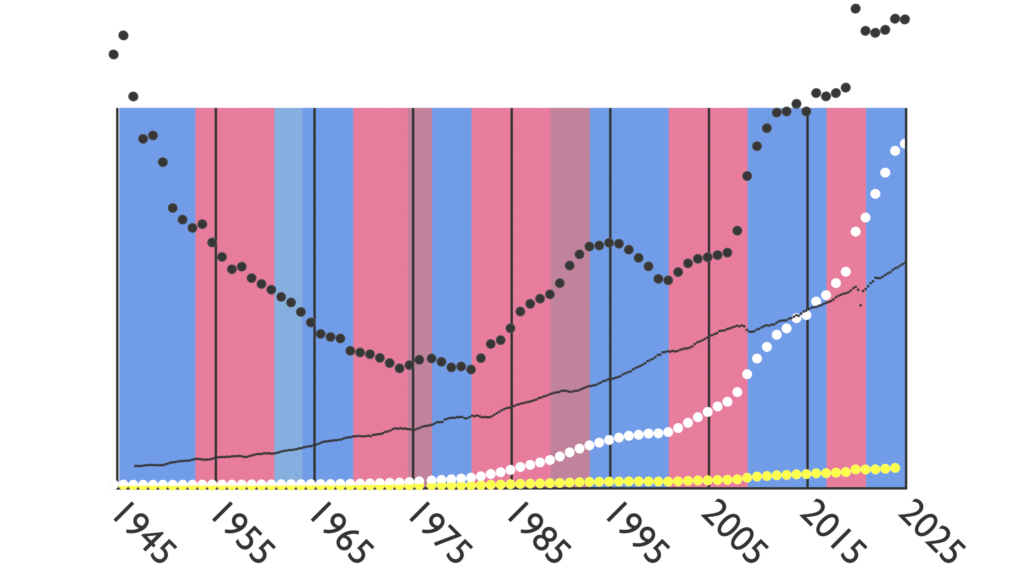
National Debt from 1945 to present, 01-21-2025.
Nominal in white.
Inflation adjusted to 1945 dollars in yellow.
As a percentage of GDP in black.
GDP is smaller black cubes.
Nominal Debt by President:
| PRESIDENT | START | END | INCREASE | % INCREASE | AVERAGE INCREASE/YEAR |
|---|---|---|---|---|---|
| Truman | 258,682,187,409.93 | 266,071,061,638.57 | 7,388,874,228.64 | 2.86% | 923,609,278.58 |
| Eisenhower | 266,071,061,638.57 | 288,970,938,610.05 | 22,899,876,971.48 | 8.61% | 2,862,484,621.43 |
| Kennedy | 288,970,938,610.05 | 311,712,899,257.30 | 22,741,960,647.25 | 7.87% | 7,580,653,549.08 |
| Johnson | 311,712,899,257.30 | 353,720,253,841.41 | 42,007,354,584.11 | 13.48% | 8,401,470,916.82 |
| Nixon | 353,720,253,841.41 | 533,189,000,000.00 | 179,468,746,158.59 | 50.74% | 29,911,457,693.10 |
| Ford | 533,189,000,000.00 | 698,840,000,000.00 | 165,651,000,000.00 | 31.07% | 82,825,500,000.00 |
| Carter | 698,840,000,000.00 | 997,855,000,000.00 | 299,015,000,000.00 | 42.79% | 74,753,750,000.00 |
| Reagan | 997,855,000,000.00 | 2,857,430,960,187.32 | 1,859,575,960,187.32 | 186.36% | 232,446,995,023.41 |
| H.W. Bush | 2,857,430,960,187.32 | 4,411,488,883,139.38 | 1,554,057,922,952.06 | 54.39% | 388,514,480,738.02 |
| Clinton | 4,411,488,883,139.38 | 5,807,463,412,200.06 | 1,395,974,529,060.68 | 31.64% | 174,496,816,132.58 |
| W. Bush | 5,807,463,412,200.06 | 11,909,829,003,511.80 | 6,102,365,591,311.74 | 105.08% | 762,795,698,913.97 |
| Obama | 11,909,829,003,511.80 | 20,244,900,016,053.50 | 8,335,071,012,541.70 | 69.98% | 1,041,883,876,567.71 |
| Trump (1st term) | 20,244,900,016,053.50 | 28,428,918,570,048.70 | 8,184,018,553,995.20 | 40.43% | 2,046,004,638,498.80 |
| Biden | 28,428,918,570,048.70 | 36,216,656,361,372.88 | 7,787,737,791,324.18 | 27.39% | 2,225,067,940,378.34 |
Debt to the Penny is used for Biden’s final numbers. Congress and the Biden Administration approved funding up to March 14, 2025; the debt reached $36,216,656,361,372.88 on that date.
Funding from that point forward is under the 2nd Trump administration and the Republican Congress.
Get your OutVote Stupid gear here!
National Debt stands at $36,216,656,361,372.88 as of 03-14-2025.
99.29% of that debt has been incurred in the last 80 years.
From Truman through the end of Biden’s final fiscal year will be 80 years evenly split – 40 years of Democrat administrations and 40 years of Republican administrations – in the White House.
From 1945 through 03-14-2025, total debt has increased $35,957,974,173,962.95.
Debt increase under Democrat administrations = $17,889,936,522,386.55, 49.75%
Debt increase under Republican administrations = $18,068,037,651,576.40, 50.25%
Republicans have incurred slightly more of the 99% of National Debt over the past 80 years.
Keep in mind this is NOMINAL DOLLARS.
Nominal comparisons are hardly fair.
The $7 Billion that Truman increased the debt would be over $87 Billion today. Eisenhower’s $22.9 Billion would be over $242 Billion.
Percentage increase is more fair as it compares similar dollar values between the start and end of each administration; but, comparing Ford’s 2-1/2 years to an 8-year administration would not be fair either.
So, here are the last 80 years’ administrations ranked in order of percent increase averaged per year:
- Truman .36%
- Eisenhower 1.08%
- Kennedy 2.62%
- Johnson 2.70%
- Clinton 3.96%
- Biden 7.83%
- Nixon 8.46%
- Obama 8.75%
- Trump 10.11%
- Carter 10.70%
- W. Bush 13.13%
- H.W. Bush 13.60%
- Ford 15.53%
- Reagan 23.29%
Out of 14 administrations, Eisenhower is the only Republican in the 6 administrations with the lowest yearly increase percentage of debt.
Carter is the only Democrat in the 6 administrations with the highest yearly increase percentage of debt.
Ironically, Reagan, who championed the current fervor for a “smaller government”, was by far the worst.
REAL DEBT
Real, used in economic terms, refers to inflation-adjusted.
As stated, it is hardly fair to compare current debt to, say, Truman’s debt when the value of the dollar is dramatically different.
National debt as of March 14, 2025 was $36,216,656,361,372.88 – just over 36 Trillion.
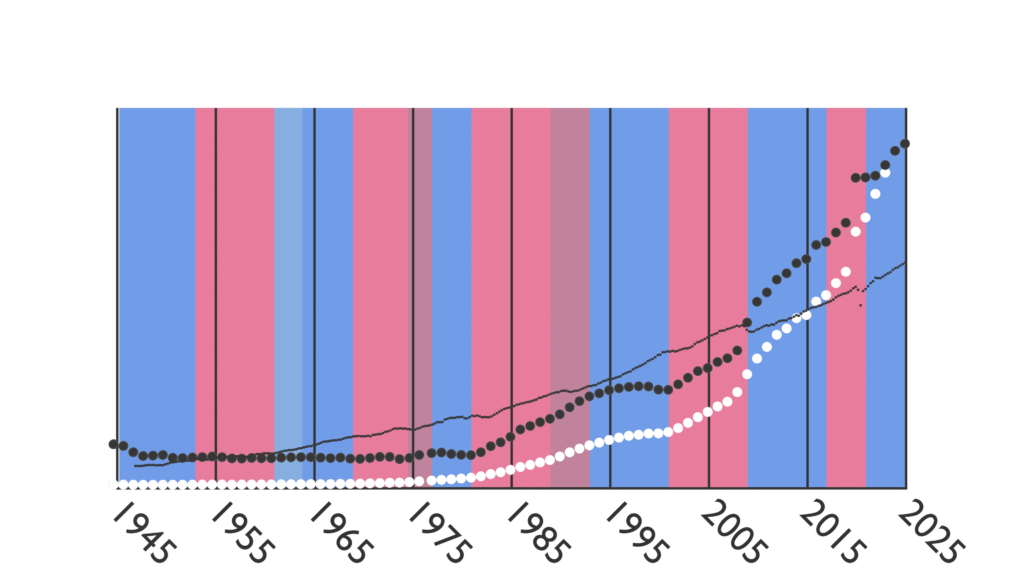
Below is national debt over the past 80 years using the same, 2024 dollar value:

National Debt from 1945 to 03-14-2025.
Nominal in white.
Inflation adjusted to 2024 dollars in black.
GDP is smaller black cubes.
